Statistics is a mathematics division involving data collection, organization, examination, and interpretation. The statistical analysis aims to derive meaningful inferences from a data sample intended to stand in for a larger population. The study of the information that was gathered will provide a chance to get a better understanding of the people.
What Is Statistical Modeling?
In statistical modeling, mathematical models and findings are combined to provide data that may be used to comprehend real-world occurrences better. The mathematical link between random variables may be shown in statistical models.
Statistical modeling is a procedure that involves using statistical models and making statistical assumptions to create sample data and make predictions about the actual world. Data scientists can understand information more effectively and illustrate the correlations between random variables.
Types of Statistical Models
Statistical models may be categorized into many categories according to the parameters. A parameter is a number, which may be numerical or quantifiable in some other way, used to describe or define a collection of data and the connection within the data. One way to think about parameters is as limits or rules that are adhered to by the data. The explanations of the statistical models are presented in the following text.
- The probability distributions that are included in parametric models all have fixed parameters that are already known to the user.
- The values of the parameters in a nonparametric model may vary over time and were not determined at the outset as they were in a parametric model.
- The parametric and nonparametric models and the fixed and flexible models are all combined in semiparametric modeling.
Statistical Techniques for Data Analysis
- Linear Regression
- Classification
- Resampling methods
- Tree-based methods
- Unsupervised learning
Linear Regression
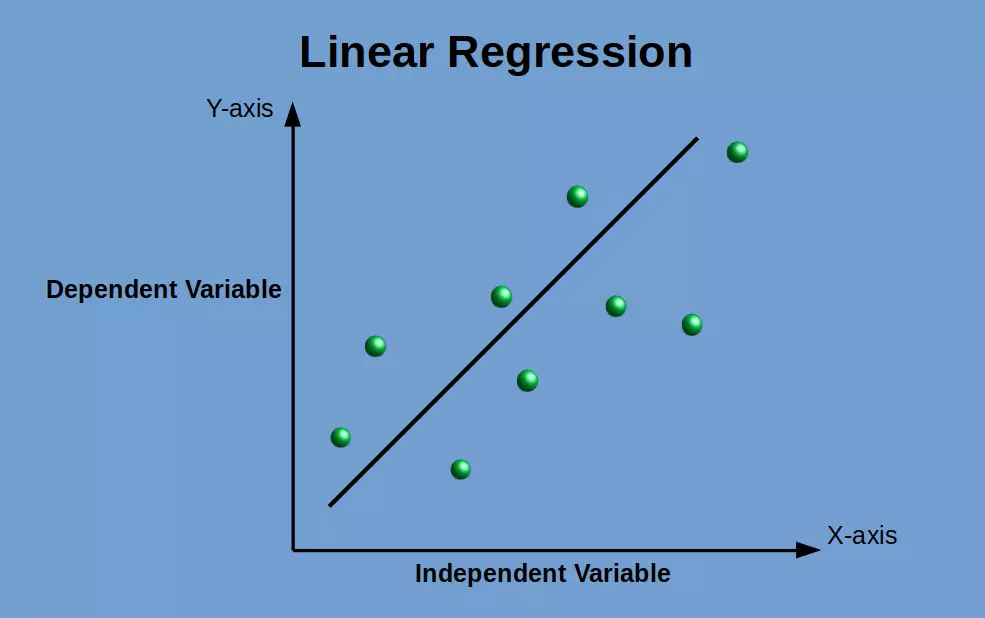
Linear Regression is a method used to predict a target variable by providing the best linear relationship between the dependent and independent variables. Best fit indicates that the sum of all the distances amidst the shape and actual observations at each data point is as minimal as is attainable. Linear Regression is a method used to predict a target variable by providing the best linear relationship between the dependent and independent variables.
There are primarily two kinds of linear Regression, which are as follows:
- A single independent variable is used in simple linear Regression to provide the most appropriate linear correlation and make a prediction about a dependent variable. Simply clicking the link will give you a more in-depth understanding of linear Regression.
- In multiple linear Regression, more than one independent variable is used to make predictions about a single dependent variable by establishing the linear connection that is most appropriate. Learn more about Multiple Linear Regression with the help of this tutorial. There is much more to discover about this topic.
Classification
Classification is a method for data mining that assigns specific categories to a set of data to enable more accurate forecasting and investigation. The following are some examples of classification methods:
- Logistic Regression is a sort of regression analysis that may be carried out when the dependent variable in question can only take one of two possible values. It is a type of predictive analysis used to explain data and the connection between one dependent binary variable and other nominal independent variables.
- In the analysis known as discriminant analysis, two or more clusters, also known as populations, are referred to as a priori. Then, a fresh data set is categorized into one of the known clusters based on the calculated characteristics. It shows the distribution of the predictors “X” separately for each of the response classes and makes use of Bayes’s theorem to rank the response classes in terms of estimates for the likelihood of the response class given the value of “X.” 78
Resampling Methods
Resampling is a nonparametric technique of statistical inference that involves the process of removing repeated parts of samples from the actual data samples. This approach is known as the “sampling of sampling.”
In addition, it generates a unique sample distribution based on the initially collected data. It uses experimental techniques rather than analytical methods to create particular sampling distributions. The following procedures must also be comprehended to have adequate comprehension of the resampling method:
- The validation of a predictive model and its performance, ensemble approaches, and assessment of bias to the variance of the model are all situations in which the Bootstrapping methodology is used. Bootstrapping is an example of one of these conditions. It does this by sampling the accurate data and replacing some samples with new ones. It then uses the data points that were “not picked” as test samples.
- The Cross-Validation approach is used here to verify the model’s performance. This technique, which may be carried out by segmenting the training data into K separate portions, is utilized. While carrying out cross-validation, the K-1 component may be regarded as a training set, while the remainder of the made-out part functions as a test set. The procedure is repeated up to K times, and after that, the weighted average of all K scores is used to determine the performance level.
Tree-Based Methods
Methods that are based on trees are the ones that are used the most often, and this is true for both regression and classification issues. They are also known as decision-tree methods because the particular splitting rules are applied to fragment the predictor space so that it can be reviewed in a tree. This is because layering or detaching the predictor space in terms of several manageable sections is an integral part of these methodologies.
In addition, the following techniques may build many trees, which can then be combined to provide accurate forecasts.
- Bagging is a technique that reduces prediction variance by generating more data for training from the actual dataset. This is accomplished by using “combinations with repeats” to construct multi-step datasets of the same size as the original dataset. The model’s predictive power cannot be increased by increasing the size of the training set; nevertheless, the variance may be decreased, which will bring about a more precise prediction adjustment to an expected outcome.
- After using boosting to compute the result using various models, an average of the development is generated using a weighted average method. Boosting is utilized to do this. An acceptable prediction efficiency may be obtained for an extended chain of input data by blending this method’s advantages and drawbacks with various weighting formulas. This allows for the creation of a complete picture of the situation.
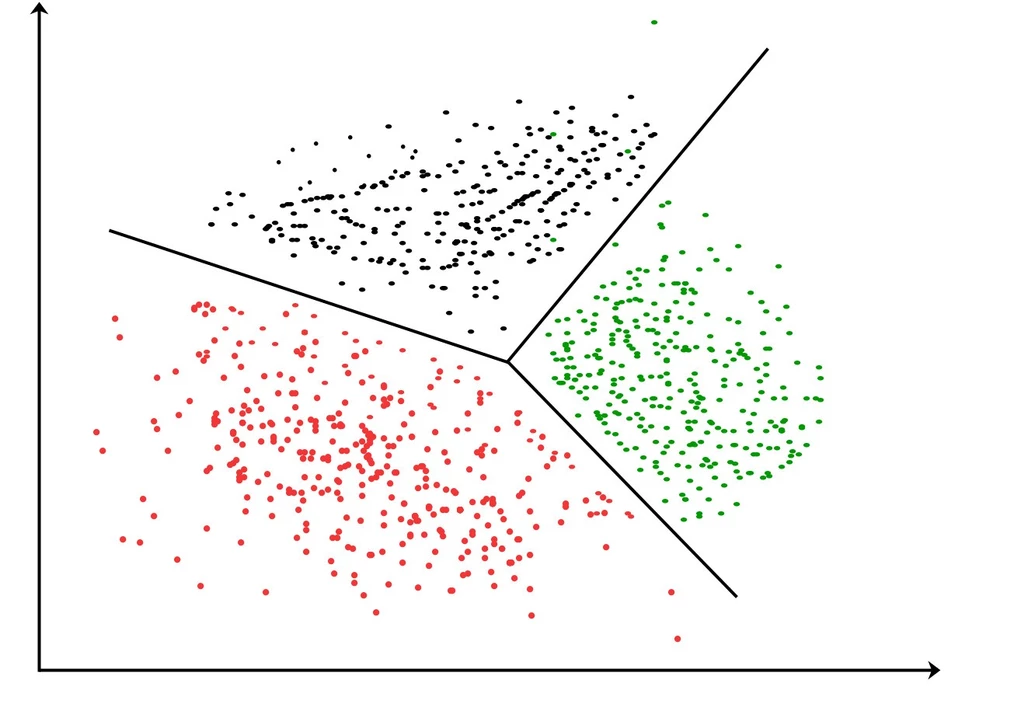
Unsupervised Learning
Unsupervised Learning methods come into play and have the potential to be used in situations in which the groupings or categories that may be found throughout the data are unknown. Unsupervised learning may be accomplished in many ways (examples of which include clustering and association rules), both of which involve assembling different data sets into categories (groups) closely connected to one another.
The following are some unsupervised learning algorithms for your perusal:
- The Principal Component Analysis helps construct a low-dimensional depiction of a dataset by identifying a linear set of the mutually uncorrelated blend of characteristics with the most significant variance. This helps to reduce the number of dimensions required for the illustration. In addition, it assists in acquiring latent interaction among the variables in a framework that is not supervised.
- Clustering by K’s Means It separates the data into k clusters, each of which is differentiated from the others by the distance from the collection from the centroid.
- A cluster tree is used to construct hierarchical clustering, which helps develop a multilevel hierarchy of clusters. Hierarchical clustering contributes to the development of a multilevel order of groups.
Applications of Statistical Modeling
Spatial Models
The co-variation of features within a geographic region is spatial dependence. This occurs when attributes at nearby places seem to be associated favorably or negatively. The issue of spatial auto-correlation arises in statistics due to spatial interdependence. Similar to the problem of temporal auto-correlation, this contradicts the fundamental principles of standard statistical methods based on the assumption of independence among data.
Clustering
The job of arranging a collection of items so that objects in the same collection (called a cluster) are more like each other than those in other groups is known as cluster analysis or clustering. It is a primary objective of exploratory data mining and a standard method for statistical data analysis.
It finds application in various domains, such as machine learning, pattern recognition, image analysis, data retrieval, and bioinformatics.
Time Series
Time-domain and frequency-domain methods are the two primary categories that may be used when analyzing time series data. Analysis techniques in the former category include spectrum analysis and, more recently, wavelet analysis; analysis techniques in the latter category include auto-correlation and cross-correlation analysis. Using scaled correlation, correlation analyses may be performed in the time domain similar to that of a filter, eliminating the need to perform operations in the frequency domain.
In addition, there is the possibility of classifying time series analysis techniques as either parametric or nonparametric approaches. The parametric techniques are based on the assumption that the underlying stochastic process is stationary and has a specific structure that can be characterized by a limited set of parameters (for example, using an autoregressive or moving average model). Estimating the values of the model’s parameters to understand better the stochastic process is the goal of these techniques. On the other hand, nonparametric techniques directly estimate the covariance or the range of the process without making any assumptions about the process’s structure and without presuming that the process has any specific system.
The procedures for analyzing time series may also be classified as linear, non-linear, univariate, or multivariate, depending on the analysis performed.
Scoring

One subcategory of predictive models is known as the scoring model. Predictive models can forecast the defaulting on loan payments, the danger of accidents, customer turnover or attrition, and the possibility of purchasing a product.
Scoring models often use a logarithmic scale, and their foundations may be found in either logistic Regression or decision trees or in a mix of many different techniques. In most cases, the scoring system is applied to transactional data, which may even be done in real-time.
Market Segmentation
Market segmentation is an advertising strategy that divides a broad target market into subsections of consumers, productions, or countries that have, or are perceived to have, everyday needs, interests, and priorities, and then designing and applying strategies to target them. Market segmentation is also known as customer profiling.
Market segmentation strategies often aim to identify and further define the target consumers and offer supporting data for aspects of the marketing strategy, such as positioning, to achieve particular goals related to the marketing plan. Businesses can develop product differentiation strategies or an undistinguishable approach involving specific products or product lines depending on the individual demand and characteristics of the target segment. These strategies and techniques may involve particular products or product lines.
Attribution Modelling

An attribution model is a rule or collection of rules that specify how credit for sales and conversions is awarded to touchpoints in conversion routes. Attribution models may be broken down into three categories: direct, indirect, and channel.
For instance, the Last Interaction model in Google Analytics gives one hundred percent of the credit for a sale or conversion to the last touchpoints (also known as clicks), which come just before them. Macroeconomic models use long-term, aggregated historical data to give an attribution weight to several channels for each sale or conversion. This allows the models to attribute a more significant value to each sale or conversion. These models are also used in the process of optimizing the advertising mix.
Supervised Classification
In machine learning, the process of inferring a function from labeled training data is called supervised classification. This process is also known as supervised learning. A collection of training examples is included with the data for training. In supervised learning, each sample is a pair with a desired output value and an input object.
These objects are given to the learner. A method for supervised learning examines the training data and generates an inferred function that can be used for mapping new instances. This function may be used to map new data. In the best possible situation, the algorithm can accurately predict the class labels for examples that have not yet been encountered.